
Igor N. Beckman
TABLE OF CONTENTS
Selective Permeation of Gases in Non-Steady-State Conditions
Separation of Gas Mixtures with Mobile Membranes
| A. | Moving Polymeric Membrane | |
| B. | Flowing Liquid Membrane | |
| 1. | Membrane Absorber-Desorber | |
| 2. | Membrane Valve | |
| 3. | Facilitated Transport through a Flowing Liquid Membrane |
The entire history of membrane technology is a struggle for separation systems with high productivity, permselectivity, flexibility, and stability. This chapter gives some critical analyses of the existing methods aimed at controlling membrane gas separation processes. Several approaches are possible: selection of materials with heterogeneous spatial structure; employment of unsteady-state gas separation processes; use of mobile membranes; application of flowing liquid membranes, etc. Special consideration is given here to the problem of raising the selectivity of membrane systems.
At present, membrane separation of gas mixtures is performed exclusively at steady-state conditions. The effectiveness of the gas separation process in this case is determined mainly by the transport characteristics of the membrane material. In order to reach high productivity and selectivity, it is necessary to control separately the effective diffusion coefficient (the selection of a polymer, chemical or structural modification of the diffusion medium, etc.) and the solubility coefficient (introduction of chemically active centers, mobile penetrant carriers, etc.).
The permeability coefficient of the jth gas component in the membrane is given by
|
P(j) - D(j)�S(j) |
(1) |
where D(j) is the diffusion coefficient and S(j) is the solubility coefficient of the jth gas component.
For a given membrane material, the productivity can be altered over a wide range by changing the thickness and the area of the membrane or by going to a more favorable geometry. The steady-state separation factor for two species is the product of the diffusion coefficient and solubility coefficient ratios, i.e.,
|
ass = (DA/DB)(SA/SB) |
(2) |
For many pairs DA/DB > 1, yet SA/SB < 1, which often leads to less efficient separation than desired. Once the membrane material is fixed, the selectivity characteristics are also essentially fixed when steady-state operation is used. This chapter points out that transient operation of the membrane can be used to alter the selectivity characteristics1. Cases will be examined where great improvements in selectivity can be realized; however, this is always accompanied by a loss of productivity.
For a flat membrane with a constant diffusion coefficient and Henry's-law coefficient for each gas, i.e., D and 5, the total amount of gas permeating the membrane in time t at steady-state is
|
qss = AtD(cH - cL)/l = AtDS(PH - PL)/l |
(3) |
where PH and PL are the upstream and downstream gas pressures, A is the membrane area, l is the thickness of the membrane, and cH and cL are the upstream and downstream gas concentrations. The steady-state transport of a gas through a membrane responds solely to the DS product. However, the transient permeation responds to D and S independently.
Different experimental permeation schemes are in use.2, 3 Typical experimental curves are demonstrated in Figure la-d: (a) the integral method; (b) the differential method; (c) the impulse method; (d) the differential impulse method. In the time-lag-type experiment (integral method), the amount of gas passing through the membrane (cH = c0, cL = 0) is measured continuously over time (see Figure la):
|
|
(4) |
The differential method is based on measurement of the change in the gas flux through the membrane (Figure lb):
|
|
(5) |
 FIGURE 1. Typical experimental curves resulting from various gas permeation methods (Curves 1 and 2 correspond to the dependence of partial pressure of the diffusion agent on the membrane input and that of the gas flux through the membrane, respectively): (a) integral method; (b) differential method; (c) impulse method; (d) differential impulse method.
When the pulsed version of the permeability method is employed, a square concentration pulse is sent to the membrane inlet and the pulse distortion occurring in the diffusion process is measured.4-6 If the square pulse duration is Dt, the time dependence of gas flux at the membrane outlet (Figure lc) is expressed by the equation
|
|
(6) |
where J∞ = Dc0A/l, u = Dt/l2, and c0=pHS; g = 0, for u< D At/l2, is the ascending part of the curve; y = 1, for u > D Dt/l2, is the descending part of the curve.
The membrane productivity decreases with decreasing time duration. Compared with the traditional versions of the permeability method, the pulsed version requires less time for the experiment and allows higher resolving power and dynamics.8 The differential gas-pulse method3 is based on the interruption of the steady-state flow of the gas, creating a series of subsequent pulses that are delivered at the membrane input (Figure Id).

The method of concentration waves is based on study of the passage of harmonic oscillations of the penetrant concentration through the membrane. For example, if the gas concentration at the membrane inlet changes according to the sinusoidal law
|
cH = 0.5c0(l + sin(wt)) |
(7) |
(where w is frequency of concentration oscillation at the membrane input), then the sinusoidal oscillation occurs at the membrane outlet at the same frequency, although with smaller amplitude and with a phase shift (Figure 2).
Under non-steady-state conditions, the flux changes at the membrane outlet follow the expression8
|
|
(8) |
 FIGURE 2. Passage of the concentration wave through the membrane: (Curve 1) change in gas concentration at the membrane inlet; (Curve 2) change in penetrant flux at the membrane outlet
![]()
Periodic oscillations occur with respect to the basic level
|
|
(9) |
At long times, the steady-state condition is attained and is maintained with periodicity:
|
Jss =Awsin(wt + d) |
(10) |
where the amplitude Aw is given by
|
|
(10a) |
the phase shift d is given by
|
|
(10b) |
and
![]()
At high w,
![]() and
d@
and
d@![]() ; at low
w, d =
wl2/(6D).
; at low
w, d =
wl2/(6D).
As compared with the classical version of the permeability method, the method of concentration waves exhibits additional degrees of freedom: the time for the output to move toward the periodic steady-state condition, the equilibrium position, the oscillation amplitude, and the phase shift.1, 8, 9 An additional degree of freedom results from the possibility of performing the experiment at various frequencies. Figure 3 exemplifies frequency characteristics (amplitude and phase) of the membrane at various values of the diffusion coefficient. It is seen that, with an increase of frequency w, the amplitude of the outcoming wave decreases (the lower the value of D, the faster the drop in amplitude), while the phase shift passes through a minimum (with further increase of frequency, oscillation takes place). The amplitude-phase diagram is given in Figure 3c. Thus, the membrane can be considered as filter of low frequencies, and the greater the diffusion coefficient, the wider the band of filtration.
 Another approach is to pulse the upstream pressure in a square wave form as illustrated in Figure 4. It should be noted that transient and non-steady-state operation of membranes may be more efficient if the membrane used is not uniform but has a certain special inhomogeneity. Hence, the following section is devoted to transport processes in such media.
FIGURE 3. Frequency characteristics of the membrane at various values of D/l2: (a) amplitude-frequency characteristics; (b) phase-frequency characteristics
| Curve | 1 | 2 | 3 | 4 | 5 |
| D/l2 | 1.26 | 2.51 | 3.98 | 6.31 | 10.0 |
(c) amplitude-phase characteristics of the membrane.
 FIGURE 4. Experimental results of the gas probe method using a set of rectangular pulses of gas: (Curve 1) values of the gas concentration at the membrane input; (Curve 2) gas flux at the membrane output.
Composite materials are widely used today in membrane technology. A targeted search for such materials requires the development of a systematic approach to the construction of membranes that have a given efficiency and selectivity, using substances with known local diffusion properties. Here we regard the prospects for using the steric and chemical organization of a heterogeneous material to control the parameters of gas separation membranes.
For the mathematical description of diffusion in a heterogeneous medium one has to take into account several features of the system3:
The number of components in the medium
The topology of the medium, i.e., the spatial arrangement of the discontinuity (layer, inclusions, dispersions of inclusions, etc.)
Variations in the topology of the medium caused by external effects or by phase transitions
Transport properties of the initial components of the medium
The type of sorption isotherm for the diffusant in each of the components of the medium
The nature of the interface between components
The type of diffusion experiment, i.e., the set of initial and boundary conditions10
It is often implied that the nature of the interaction between a solute and the solvent is best investigated when the solute concentration approaches the infinite dilution limit. In this limit, solute-solute interactions can be neglected. However, for solid polymers specific sorption sites appear to exist and thermodynamic properties measured in the very low range of solute concentrations may not reflect the solute-solid polymer interaction at all. This is especially true at low temperatures because the fraction of solute molecules associated with such extra sites increases as temperature decreases.11
Another aspect of the problem of solute trapping is related to the effect of such interactions upon the mobility of the solute molecules. It is clear that the solubility determined from the integrated flux measured in a permeability experiment will not, in general, be equal to the solubility that would be determined in an equilibrium situation, e.g., gas-polymer equilibration.
We now consider gas molecules that migrate in the polymer matrix via random walks that are interrupted by trapping into various imperfections (the point inclusions in a polymer�holes, cavities, or gaps between stiff chains) existing in a solid. The sample is believed to contain the penetrant in two energetically distinguishable sites: in the continuous phase of the polymer (i.e., "normal") and in the inclusions (i.e., "trapped").
Certain types of energy diagrams for diffusion in a two-component medium are shown in Figure 5. The migration of the diffusant is determined by the positions of the two potential wells of types 1 and 2 relative to the zero level (i.e., by the energies G1 and G2) and also by the magnitude of the energy barriers on entrance to and exit from the potential well (DG11 = DGD1 for a transition in the base matrix, DG12 for a transition from the base matrix to an inclusion, DG22 = DGD2 for diffusion in an inclusion, and DG21 for exit from an inclusion to the base material of the specimen). A state with a lower free energy (Figure 5a) fills up with diffusant spontaneously (a "trap"). The transition to another phase may be hindered (DG12 � DG11 = DGL). The height of this barrier between two adjacent states (1-2) can be either higher or lower than the normal height in the case of undisturbed diffusion (1 → 1). If the second phase has finite dimension, the transitions of 2 → 2 types should be considered as well (see the energy diagram in Figure 5b).
The gas solubility in a heterogeneous membrane (average concentration
![]() ) is defined by the formula12
) is defined by the formula12
|
|
(11) |
where j1 = V1/Vsamp and j2 = V1/Vsamp are the volume fractions of components 1 (the polymer) and 2 (inclusions or traps), respectively (Vsamp is the sample volume, Vsamp = V1 + V2).
 FIGURE 5. Energy diagram for one-dimensional diffusion (x is distance), where the nomenclature 1 indicates a "normal" site and 2 indicates a trapping site: (a) point defect (trap); (b) inclusion.
There are several variants of the dual mode sorption model 13-19:
Dissolution in the continuous phase and in the inclusions is described by Henry's law: c1= S1, p0 and c2 = S2p0, where S1 and S2 are solubility constants and p0 is the partial pressure of penetrant at the membrane inlet (the Henry I � Henry II model).
Dissolution obeys Henry's law, and "hole-filling" obeys a Langmuir expression (the Henry-Langmuir model).
The model is given by superposition of Langmuir I and Langmuir II expression (the Langmuir-Langmuir model).
Dissolution obeys Henry's law, and "hole-filling" obeys a Freundlich expression (the Henry-Freundlich model), etc.
Treatment of sorption in microvoid environments with typical void dimensions of truly molecular scale is provided by extension of Polyany's adsorption potential theory for surfaces to treat microporous materials. This treatment13 allows for energetic heterogeneity of the sorption "sites". Such an approach is more general than the Langmuir treatment, which assumes that the enthalpy of sorption in the microvoid that forms is essentially independent of the degree of site saturation. The superposition of Henry's law with Dubinin's isotherm leads to a complicated situation.14
The exchange of diffusant between the two types of potential wells is usually represented in the form
|
|
(12) |
where V1(A) and V2(A) are the diffusant molecules in potential wells of types 1 and 2, respectively, V1(0) and V2(0) are vacant sites, and k1, is the rate constant for the passage of diffusant molecules from one energy state to another.
The equilibrium reaction constant for exchange of gas atoms between the components of a heterogeneous medium is11,12
|
|
(13a) |
where c1 = n1/V and
c2 = n2/V are the concentrations of the gas atoms in sites 1 and 2, respectively;
clm = nlm/V and c2m =
n2m/V, where nlm = m1N1, and
n2m = m2N2 are tne capacities of sites 1 and 2, respectively;
q1 = n1/N,
q2 = n2/N,
q = q1 +
q2; f1 =
N1/N2 = V1/V,
f2 = N2/N = V2/V;
N1 + N2 = N, f1 +
f2 = 1; N1, and N2 are the number of states 1 and 2;
b1 and b2 are Langmuir's sorption isotherm parameters of components 1 and 2. The relative populations are
![]() =
n1/N1 and
=
n1/N1 and
![]() =
n2/N2, where n1 and n2 are the numbers of diffusant molecules occurring in states 1 and 2. Each site contains up to m gas atoms, where
m has values between 1 and ∞. The total population (solubility) of the two-component system is
q = n/N = (n1 + n2)/(N1 +
N2), and the mean population is
=
n2/N2, where n1 and n2 are the numbers of diffusant molecules occurring in states 1 and 2. Each site contains up to m gas atoms, where
m has values between 1 and ∞. The total population (solubility) of the two-component system is
q = n/N = (n1 + n2)/(N1 +
N2), and the mean population is
![]() . If
m1= m2 = 1, then
. If
m1= m2 = 1, then
|
|
(13b) |
If m1 = m2→∞, then
|
|
(13c) |
Mathematically a trapping effect has been introduced in Fick's law by adding reaction between mobile gas atoms and stable distribution of traps. The basic equation of motion is as follows15:
|
|
(14) |
where
![]() represents the kinetics implied by process given by Relation
12.
represents the kinetics implied by process given by Relation
12.
In the partial immobilization models,16 a diffusion coefficient is assigned to each of the penetrant populations. The unidirectional flux Jx is given by the linear combination of two Fick's-law contributions:
|
|
(15) |
where D1 is associated with the population of component 1, and D2 with diffusion of population of component 2.
Applying Fick's second law to j species (j = 2 for dual sorption), we have
|
|
(16) |
(where "S" means summation over all the species).
Some variants of the dual mode sorption models and their consequences are given in Table 1.
Let us consider the diffusion of gas in a solid formed as a mixture of two polymers, one of which is the continuous phase (phase 1) and the other one forms point inclusions (phase 2) capable of interacting with the diffusant12 (the Henry I [mobile]-Henry II [immobile] model). Let us suppose that point inclusions or isolated point defects with an unlimited capacity (m1→∞ and m2 →∞) are randomly distributed in the bulk of the polymer membrane. In the course of their random motion, molecules of the diffusing agent are trapped by the defects and are excluded for a definite time interval from the diffusion process. This process, called gas diffusion with reversible trapping, can be described by the following differential equations20:
|
|
(17a) |
|
|
(17b) |
where c1 and c2 are the concentrations of the diffusing agent in the diffusion channels and traps, respectively, and
k1* = k1N2 and k2* = k2N1
The first-order chemical reaction kinetics is used for describing the trapping of gas molecules by the matrix and subsequent release of the gas.
The trapping reaction is
|
site + gas molecules
|
(18) |
A quasichemical equilibrium is shifted to the left-hand side at high temperatures, favoring movement of the gas to its mobile state and vice versa. The equilibrium constant of the trapping reactions is
|
|
(19) |
TABLE 1 Versions of the Dual Mode Sorption Model
| N | Number of ways of diffusing | Number of thermodynamic states | Types of sorption isotherm | Sorption isotherms | Differential diffusion equation | Effective diffusion coefficient |
| 1 | 1 | 1 | Henry | C = Sp0 |
|
D |
| 2 | 1 | 2 | Henry Henry |
C1 = S1P0 C2 = S2p0 |
|
|
| 3 | 1 | 2 | Henry Langmuir |
C1 = Sp0
|
|
|
| 4 | 1 | 2 | Langmuir Langmuir |
|
 |
|
| 5 | 2 | 2 | Henry Henry |
C1 = S1P0
C2 = S2p0 |
|
|
| 6 | 2 | 2 | Henry Langmuir |
C1 = S1P0
|
|
 |
| 7 | 2 | 2 | Langmuir Langmuir |
|
  |
|
 ,
S1 and S2 are solubility constants in states 1 and 2 (Henry's isotherms),
b1 and b2 are equilibrium constants of gas-absorption center systems in states 1 and 2 (Langmuir's isotherms),
C1m and C2m are maximum absorption capacity in states 1 and 2 (Langmuir's isotherms),
C = C1 + C2 is the total concentration,
k1*=k1C2m and
k2*=k2C1m,
,
S1 and S2 are solubility constants in states 1 and 2 (Henry's isotherms),
b1 and b2 are equilibrium constants of gas-absorption center systems in states 1 and 2 (Langmuir's isotherms),
C1m and C2m are maximum absorption capacity in states 1 and 2 (Langmuir's isotherms),
C = C1 + C2 is the total concentration,
k1*=k1C2m and
k2*=k2C1m,
![]() ,
,
![]() ,
,
 .
.
or
|
|
(19a) |
If N1 = N, then
KH = Nf2
The time dependence of the gas flow through the membrane containing a dispersion of defects of unlimited capacity is described by the following expression12:
|
|
(20) |
where
![]()
![]()
![]()
![]()
and c0 is the gas concentration at the membrane inlet.
 Figure 6 shows the permeability curves calculated from Equation 19 for the different values of the parameters
k1* and k2*. The presence of point inhomogeneities in the structure is seen to increase the time before the flow can reach its steady state, as compared with diffusion in a homogeneous medium. As the capture constant increases, the time lag increases and the kinetic curve broadens and acquires a more asymmetric form.
Figure 6 shows the permeability curves calculated from Equation 19 for the different values of the parameters
k1* and k2*. The presence of point inhomogeneities in the structure is seen to increase the time before the flow can reach its steady state, as compared with diffusion in a homogeneous medium. As the capture constant increases, the time lag increases and the kinetic curve broadens and acquires a more asymmetric form.
Now we consider a concentration wave passing through defect media. The square concentration wave is sent to the membrane inlet, and the gas flux J(t) is measured at the membrane outlet. Then the diffusion coefficient can be determined using a Fourier J(t) transformation. As far as the system of equations given by Expression 20 is linear, linear superposition of some of its solutions gives the problem solution.
FIGURE 6. Kinetic curves of gas permeability through a medium containing a dispersion of point defects or inclusions; gas absorption in the polymer and the defects is described by Henry's isotherms (for the Henry I [mobile]-Henry II [immobile] model), D/l2 = 1, and the capture reaction equilibrium constant KH = 10: (Curve 1) k1*=100 s-1, k2* = 10 s-1; (Curve 2) k1* = 10 s-1, k2* = 1 s-1; (Curve 3) k1* = 1 s-1, k2* = 0.1 s-1; (Curve 4) k1* = 0.1s-1, k2* = 0.01 s-1; (Curve 5) k1* = 0.01 s-1, k2* = 0.001 s-1.
Consequently, expanding the inlet gas concentration into a Fourier series,
|
|
(21a) |
and solving the problem for some harmonics, one can obtain the outlet in the form of a harmonic sum:
|
|
(21b) |
where An and Bn are the concentration and outlet flux Fourier coefficients, accordingly. The solution for the first harmonic of the flux is described by the following expression21:
|
|
(22) |
where Y = iwl2(k1 + k2 + iw)/(D(k2 + iw)) and A1 is the first harmonic of inlet concentration. Then Bn = AnDYi/2/(sinhYi/2l). The diffusion coefficient can be determined using the Fourier transformation coefficients of the outlet flux and the inlet concentration ratio.
An important special case of the model is given when the trapping reaction has reached its thermal equilibrium.22-27 Differential Equation 17 reduces to the simple Fick's type, with Dapp, which is smaller than D for undisturbed diffusion. If the local equilibrium is reached during the experiment (k1*c1 = k2*c2), the observed diffusion coefficients Dapp may be related to the diffusion coefficient for the mobile gas, D, by the following: If k1*c1 = k2*c2, then (see Table 1, Case 2)
|
|
(23a) |
where
|
|
(23b) |
These results are derived by considering the equilibrium distribution of gas molecules between normal sites and traps. The expressions for the diffusion coefficient are correct if this equilibrium is established rapidly compared with the rate of diffusion of the gas out of the solid, and this condition is satisfied in many experiments.
The effective gas solubility in heterogeneous membrane is defined by
|
|
(24) |
The permeability constant is given by
|
P = P1f1 =D1S1f1 |
(25) |
because in dilute dispersions f2<<1 and f1 @ 1, P @ D1S1, i.e., when sorption centers of unlimited capacity are present in the membrane, the permeability constant in a defective medium is approximately equal to the permeability constant for an undisturbed matrix.
The main class of "microheterogeneous" structures is made up of dispersion media, i.e., solids containing a dispersion of inclusions of a specific shape and size. The thermodynamic and kinetic properties of the dispersed phase differ from those of the continuous base material.10, 28 - 31
The sorption process is assumed to be isothermal, and linear isotherms are assumed.
a. Gas Permeability of Material with Inclusions of Another Polymer
The kinetics of gas diffusion into the plate containing inclusions (microspheres) obeys the following differential equations30:
|
|
(26a) |
|
|
(26b) |
C2=KC1
where C1 is the continuous matrix (macropore) gas concentration, C2 is the inclusion (micropore) gas concentration, D1 is the matrix diffusivity, D2 is the inclusion diffusivity (D2 << D1), r0 is inclusion radius, n2 is number of microspheres (inclusions) per unit sample volume, r is the distance from microsphere center, K = S2/S1 and x is the distance in a flat membrane.
The initial and boundary conditions are
|
C1(x,0)=0 |
C2(r,0)=0 | C1(l,t)=CI0 |
|
|
C2(r0,t)=KC(x,r0,t) |
|
||
where l is the thickness of the membrane. The transmembrane flux of gas12 is
|
|
(27) |
where xmn are the roots of the following transcendental equation:
mxmn2 + kh(1-xmncotxmn) = p2/m2
where m = D2l2/D1r02, h = YD2l2/r0D1 = f2 m, Y = 4p r02n2 = 3f2/r0, f2 = Vincl/Vsamp , Vsamp = Al (volume of sample), and t = Dlt/l2.
A phenomenological theory of transport in dispersion media was proposed by Maxwell to describe the electrical conductivity of dispersions and then adapted to the problem of thermal conductivity and diffusion (the history of the problem is given in Reference 28).
For a dispersion of inclusions of identical shape and size (modified by Maxwell formula),
|
|
(28) |
where

a0 being a geometrical factor depending only on the shape of the inclusion.
The value of a0 is a measure of the distortions of the flow lines, i.e., the lines along which the product of the diffusion coefficient and the gradient of the diffusant concentration remains constant: for a given P2/P1 the smaller a0, the greater the distortion. For some simple forms of inclusions a0 can be calculated analytically: e.g., a0 = 3 for inclusions with a spherical shape and 2 for inclusions in the form of cylinder with its axis perpendicular to the diffusion flow, etc.
Equation 28 is valid for dilute suspensions (f2 < 0.3); on changing to closest packing of the inclusions, additional terms must be introduced into Formula 28. On the whole, Equation 28 is satisfied as long as the inclusions retain a definite shape and continuous diffusion flows along one of the components of the heterogeneous medium are possible. It should be noted that when there is phase reversal (i.e., when the matrix and the inclusion change roles), "hysteresis" of permeability may occur.
Using mathematical simulation methods to test known published models showed10 that there is a rigorous mathematical description only for cases of parallel diffusion and for diffusion in a lamellar medium. When extended inclusions of a specific shape and size are present, an analytical description is possible for certain simple forms (sphere, cylinder, spheroid), for which the "experimental" values of a0 agree with the theoretical values and for f2 ≤ 0.3. As f2 increases, the description of the process by the analytical formula becomes worse, with P/P1 approaching P2/Px more rapidly than the theory predicts. The geometrical parameter a0 depends not only on the ratio of the width of the inclusion to its length but also on the "distorting power" of the particular form of inclusion as regards the diffusion flow lines.
Numerical modeling methods can be used to find the values of a0 for inclusions with the "exotic" shape of rectangular blocks, crosses, etc., for a lamellar medium with variable boundary, and also to study the evolution of a0 by reversal of phases, which involves nucleation and growth of the new phase, etc. In particular, the modeling method gives the value a0 = 1.55 � 0.15 for an infinite block with a square cross section placed perpendicular to the direction of flow. This value is smaller than the value a0 = 2 for a cylinder because a block with a square cross section distorts the diffusion flow lines considerably more severely. The common form of notation that we use here for the permeability of the main types of structure shows clearly the general character of the modified Maxwell formula (Equation 28), from which the other diffusion models arise as special cases when an appropriate choice of the geometrical form parameter a0 (a0 ≥1) is made. The limiting cases are parallel diffusion (a0 =∞) and sequential diffusion (a0 = 1).
A special class is formed by structures generated from dispersions of point inclusions as the volume fraction of the latter is increased (for brevity, we shall call such heterogeneous substances percolation-type structures). As concentration of the defects increases, the point inclusions are joined together in extended formations (clusters) and the dispersion is characterized by functions of the size and shape distribution of the clusters. In spite of the random nature of the cluster formation, this type of dispersion medium obeys strictly defined statistical rules and the evolution of the system can be quantitatively described in terms of percolation theory, using such concepts as the percolation threshold and the critical index.33-35 At a certain value of the volume fraction a continuous cluster is generated (there is "puncturing" of the membrane, accompanied by a sharp change in transport properties).
The dependence of the permeability on the volume fraction of the second component is shown in Figure 7 for various types of structures. The P(j2)/P1 curves lie between the two limiting cases: dissociative or parallel diffusion (the straight line, 1) and diffusion in a lamellar medium (Curve 2). Exceptions are provided by dispersion structures of the percolation type. The dependence of P/P1 on the local transport parameters envisages an effect of the intercomponent layers on the transport (in this case a situation arises that requires the solution of the a "three-phase" diffusion problem for a two-component medium). Depending on the conditions at the boundary between the components, the P(j2)/P1 curve may pass below the straight line for the limiting case a0 = 1, corresponding to a low permeability of the intercomponent layer (D12 → 0, Curve 3), with a possible minimum on the curve, or it may be completely within the permissible region (the permeability of the intercomponent layer lies between the corresponding values for the components of the medium, (Curve 4), or it may be situated above the limiting straight line for a0 =∞. The last situation arises when the permeability is high at the boundary (i.e., when D12>> D11 and D12>>D22, Curve 5), a maximum on the P(j2)/P1 curve being possible.
 FIGURE 7. The permeability of percolation-type structures: (Curve 1) parallel diffusion; (Curve 2) lamellar medium; (Curves 3 through 5) percolation structures for which Dl2
→0 (3), D11< D12 < D22 (4), or Dl2 >> D11 and D12 >>D22 (5), where D11 and D22 are the
gas diffusion coefficients with respect to the components 1 and 2, respectively,
and D12 is the diffusion coefficient for gas transfer from
component 1 into component 2.
FIGURE 7. The permeability of percolation-type structures: (Curve 1) parallel diffusion; (Curve 2) lamellar medium; (Curves 3 through 5) percolation structures for which Dl2
→0 (3), D11< D12 < D22 (4), or Dl2 >> D11 and D12 >>D22 (5), where D11 and D22 are the
gas diffusion coefficients with respect to the components 1 and 2, respectively,
and D12 is the diffusion coefficient for gas transfer from
component 1 into component 2.
Effective medium percolation theory32, 34 gives the following expression for the effective permeability P of a random mixture of particles of two differing permeabilities P1 and P2 32:
|
|
(29) |
where f2 is the volume fraction of component 2. The expression is independent of particle size.
We shall now turn to the problem of the membrane separation of a mixture of gases and assess the prospects for a directed choice of the structure of the heterogeneous medium in order to achieve the optimum efficiency and selectivity for the membrane.
Suppose that a mixture of two gases is supplied to the upstream side of a membrane, and suppose that the transport process of each of them through the membrane is characterized by its own set of parameters D, K, P/P1, and q. These parameters are regarded as being dependent on the composition and topology of the membrane but independent of the composition of the gaseous mixture. We shall take as the selectivity factor the relationship
|
|
(30) |
where cA = PA/P1A and cB = PB/P1B are the ratios of permeabilities of the first (target) and the second gases, respectively, and a1 = P1A / P1B (P1A is the permeability of gas A in phase 1, and P1B is the permeability of gas B in phase 2).
The operational effectiveness of a gas-separating system is characterized by two parameters: the efficiency (i.e., the permeability for the object component, cA), which determines the amount of product obtained, and the selectivity, which determines the purity of the product.
The effects of the local transport parameters of the heterogeneous medium on the flow of the object component cA and on the selectivity factor a are different: A decrease in D2A/DA and KA leads to reduction in cA and a, but a decrease in D2B/D1B and KB increases a while leaving cA unchanged. Because the change in cA and a in heterogeneous structures of different types takes place differently, then, depending on whether the membrane works by purification or enrichment, these parameters will have the optimum values for quite different spatial organizations of the material. It follows from Equation 30 that a is a function of six parameters (if the topological factor a0 is taken as one of them). We shall therefore restrict ourselves to a few examples.
The first two examples are taken from Reference 36, in which measurements were made of the gas permeability of PVTMS (Component 1)-PDMS (Component 2) block copolymers of various compositions; PVTMS represents poly(vinyltrimethylsilane), and PDMS represents polydimethylsiloxane. We shall discuss Kr-Xe and H2-Xe gas mixtures. For a Kr-Xe mixture the experimental separation factor (a = 0.56) is close to the value calculated (0.61) for the parallel diffusion mechanism. However, there is considerable discrepancy between the experimental and calculated values of cA (2.04 and 10.4, respectively). This might be explained by an extra resistance to transport at the boundaries between the components of the block copolymer. In this case the membrane used in the experiment is close to the optimum from the point of view of concentrating the Kr. In using a membrane for Xe purification, the membrane efficiency can be increased (by a factor of 5) if a structure that ensures a parallel diffusion mechanism is created.
For a H2-Xe mixture the theoretical value of the efficiency with respect to the target gas (H2) is slightly dependent on the structure of the membrane and is close to the experimental value (evidently, for hydrogen, resistance to diffusion at the boundary between the components does not play a significant role). However, the theoretical analysis shows that the membrane structure used in the experiment was not the optimum as regards selectivity; in this case a lamellar membrane should be used.
The effect of the structure on the gas-separation parameters cA and a is conveniently studied using topology-property diagrams. To construct such diagrams (Figure 8), the reciprocal of the geometrical factor a0 is plotted along the abscissa, with cA and a as the ordinate.
 These diagrams first of all, enable the geometrical factor
a0 to be estimated from gas permeability data. The value
a0 can be determined experimentally by measuring either the efficiency of the membrane or the separation factor. The agreement between the
a0 values found by different methods indicates the absence of resistance at the boundary between the components. The discrepancy between the values of
a0 obtained from cA and
a (in Figure 8 the range of uncertainty for a0 is shaded) is large for the Kr-Xe mixture (Figure 8a), far larger than the corresponding range for the H2-Xe mixture (Figure 8b).
These diagrams first of all, enable the geometrical factor
a0 to be estimated from gas permeability data. The value
a0 can be determined experimentally by measuring either the efficiency of the membrane or the separation factor. The agreement between the
a0 values found by different methods indicates the absence of resistance at the boundary between the components. The discrepancy between the values of
a0 obtained from cA and
a (in Figure 8 the range of uncertainty for a0 is shaded) is large for the Kr-Xe mixture (Figure 8a), far larger than the corresponding range for the H2-Xe mixture (Figure 8b).
FIGURE 8. Permeability (or selectivity)-topology diagrams (abscisses are the inverse geometric factor values l/a0; ordinates are P and a): (a) separation of a Kr-Xe mixture in a poly(vinyltrimethylsilane) (PVTMS)-poly(dimethyl siloxane) (PDMS) block copoly-mer; (b) separation of a H2-Xe mixture in a (PVTMS)-(PDMS) block copolymer.
Such diagrams can thus be used for diffusion-structure analysis, i.e., to determine the topological characteristics of a membrane used in a separation process. On the other hand, they can be used to select the optimum structure for a gas-separating membrane because, for known transport properties of the individual components, they display clearly the properties of heterogeneous structures. In the case shown in Figure 8a, selection of structure enables, primarily, the membrane efficiency to be controlled, altering it by an order of magnitude; the selectivity, however, is only altered by a factor of 1.5. Figure 8b illustrates the reverse case�the structure of the membrane controls mainly the selectivity while the efficiency remains almost constant.
The complex nature of gas diffusion in real polymeric materials was exhibited in the experiments with radioactive isotopes and by using autoradiographic techniques.37-40. For example, nonuniform distribution of radioactive gas on both the upstream and downstream surfaces of a membrane was demonstrated by this method in the research of the Rn diffusion through the polypropylene films with spherulite structure.38
Description of the permeation processes through heterogeneous polymers requires introduction of the concept of local solubility and diffusivity spectra. The spectra have asymmetric shape and change during the course of the diffusion process development.
This feature of heterogeneous gas-separation membranes should be considered by using the concept of local coefficient productivity spectrum (i.e., the spectrum of fluxes through separate parts of the membrane) and the local separation factors. In order to check this assumption, a mixture of tritium and radon was passed through a membrane of polypropylene. Recording of each gas is carried out separately by using photographic plates that are sensitive either to b- radiation of tritium or to a radiation of radon. The autoradiogram was photometered on a scanning microphotometer and a kind of topographical map was obtained, I(y, z) [Figure 9].38-39 A map of the inert-gas distribution obtained in this way at the output of a polypropylene membrane (Figure 9a) allows us to determine the spectra of the local diffusion coefficients and solubility constants of the inert gas in the membrane material (see Figure 9b).
It is seen from the maps that the film is significantly nonuniform for the diffusion process of both tritium and radon. There are regions of two kinds: with abnormally low concentration of diffusant (center of spherulite) and with abnormally high concentrations of diffusant (boundary of spherulite). There is a certain correlation between the distribution functions of tritium and radon on the membrane surface, but there are substantial differences (Figure 10a). They are determined by the different value of solubility and diffusion of these gases in particular morphological formations of polypropylene. These differences become more evident by introducing the concept of the local separation factor spectrum.
In accordance with Fick's law for each diffusant,
|
|
(31) |
Then the local non-steady-state separation factor is
|
|
(32) |
where
|
|
(33) |
Relative density of the darkening is easily determined from the autoradiography data. A typical p(y) curve for the tritium-radon-polypropylene system is shown in Figure 10b. In the vicinity of a spherulite center, the r parameter is seen to increase (at the spherulite boundary r = 1). Figure 10b gives the curve of the distribution function of r(y) over the membrane surface, measured for different diffusion times (t = tLT2 and t = 2tLT2, where tLT2 is the time lag of tritium diffusion over the whole membrane, measured from the permeability kinetic curve). It is seen that aloc = f(t), and, as the steady-state permeability mode is approached, the aloc(y, z) spectrum becomes more uniform.
The use of heterogeneous membranes thus requires introduction of the notion of non-steady-state local separation factor.
Table 2 lists the interrelations between the local and overall (i.e., measured for the whole membrane surface), steady and unsteady, and integral (i.e., measured by the amount of the passed gas) and differential (i.e., measured by the gas flow through the membrane) selectivity factors.
 FIGURE 9.
Diagnostics of polypropylene membrane, using a 222Rn diffusion
probe: (a) map of the 222Rn distribution in the polymer
membrane, constructed on the basis of autoradiography results; (b) spectra of
local diffusion coefficients 222Rn in the virgin membrane
(Curve 1) and the membrane thermally treated at 80 to 100�C (Curve 2).
FIGURE 9.
Diagnostics of polypropylene membrane, using a 222Rn diffusion
probe: (a) map of the 222Rn distribution in the polymer
membrane, constructed on the basis of autoradiography results; (b) spectra of
local diffusion coefficients 222Rn in the virgin membrane
(Curve 1) and the membrane thermally treated at 80 to 100�C (Curve 2).
 FIGURE 10. Results of the autoradiographic measurements of local transport and selectivity characteristics for polypropylene with large spherulite structure: (a) distribution of relative darkening densities over the membrane surface for tritium (Curve 1) and radon (Curve 2); (b) distribution of
r(y) for T2/Rn gases over the membrane surface for distribution time t =
tLT2 (�
� � � �) and distribution time t = 2tLT2 (��).
FIGURE 10. Results of the autoradiographic measurements of local transport and selectivity characteristics for polypropylene with large spherulite structure: (a) distribution of relative darkening densities over the membrane surface for tritium (Curve 1) and radon (Curve 2); (b) distribution of
r(y) for T2/Rn gases over the membrane surface for distribution time t =
tLT2 (�
� � � �) and distribution time t = 2tLT2 (��).
In contemporary membrane technology, gas mixtures are separated exclusively under steady-state conditions. The results are analyzed by means of Formula 2 in Table 2, i.e., the separation factor is defined as ass= PA/PB. Under steady-state conditions it is impossible, by definition, to separate a mixture of gases A and B for which PA = PB. Such a mixture can, however, be separated if one makes use of the unsteady-state separation mode.
TABLE 2 Separation Factors
|
Local, nonsteady, differential |
|
 |
(1) |
| Local, steady | |
 |
(2) |
| Local, integral | |
 |
(3) |
| Total, steady, differential | |
 |
(4) |
| Total, integral | |
 |
(5) |
The time dependence of gas flow through the membrane is described by Equation 5. In the case of studying the permeability of two gases in a homogeneous medium, the unsteady-state separation factor is determined by the equation
|
|
(34) |
Thus, in contrast to the steady-state separation factor, the non-steady-state separation factor depends on the time of diffusion. According to Equation 34, at short diffusion times larger separation factors are reached, and, when t→∞, aus → ass. Non-steady-state modes allow us to reach unlimitedly high selectivity factor values, although at the expense of the separation process productivity. Therefore, under real conditions, one should select the time interval of sampling that provides a compromise between the membrane throughput and the selectivity.
Let us consider the passage of a square concentration pulse consisting of a binary gas mixture through the membrane.1, 9, 41 In this case, the membrane acts as a kind of chromatographic column. At the membrane outlet, separation of the mixture components takes place. Figure 11 shows, as an example, the results for concentration pulses of various time durations of a two-component (A and B) gas mixture (50:50) through the membrane. Let the permeability coefficients of gases A and B in the membrane be equal, PA = PB, whereas the diffusion coefficients of these gases in the polymer are different. DA = 10DB. Figure 11 shows that, at short times, component A is the main species present, at moderate times, a mixture of the components is observed, and at long times, the component B predominates. Figure 11 also shows that the peak resolution decreases with increasing pulse time duration. Thus, the separation efficiency of the membrane cell can be controlled by selecting the pulse duration and adjusting the time intervals within which the choice of the output gas is enriched with "fast" or "slow" gas mixture components is performed.
 FIGURE 11. Separation of a two-component gas mixture under pulsed conditions: (a) concentration pulse length
Dt = 0.15tLB; (b) concentration pulse length
Dt = 0.40tLB; (c) experimental data for He-CO2 gas mixture diffusion.
FIGURE 11. Separation of a two-component gas mixture under pulsed conditions: (a) concentration pulse length
Dt = 0.15tLB; (b) concentration pulse length
Dt = 0.40tLB; (c) experimental data for He-CO2 gas mixture diffusion.
For quantitative description of the membrane separation process under pulse conditions, we introduce the term of differential unsteady-state separation factor:
|
|
(35) |
|
|
where ass = SADA/(SBDB) is the steady-state separation factor, Ka = FA/FB is the selectivity parameter, and a(t) = assKa is the differential unsteady-state separation factor.
It is clear that, at Dt→∞, Ka→1 and a(t) = ass, i.e., at longer time durations of the concentration pulse at the inlet, the non-steady-state separation factor turns into the steady-state one. It should be noted that ass is defined by the ratio of the permeability coefficients PA = SADA and PB = SBDB, whereas the Ka parameter is defined by the diffusion coefficients alone.
Figure 12 shows the dependence of the selectivity parameter Ka on the pulse time duration and the time for selection of gases at the outlet from the membrane. A possibility of the inversion of selectivity parameter in the course of the experiment is obvious. It is seen that, at long time durations of the pulse and short measurement times, Ka>>1 (i.e., the outcoming flux is enriched with the "fast" component), whereas at short pulses and long diffusion times, Ka << 1 and the mixture is enriched in the component with the lower diffusion coefficient.
 FIGURE 12. Dependence of the selectivity parameter Ka on pulse duration and measurement time (PA = PB, DA = 10DB).
Thus, it follows that the pulsed version of the permeability method allows us to separate gas mixtures that cannot be separated under steady-state conditions.42
Now we consider the passage of the concentration wave through the membrane, where the wave consists of the mixture of two gases, A and B.9
At the membrane inlet, the following equation holds:
|
|
and |
|
(36) |
Then the flux at the membrane outlet is
|
JT = JA + JB |
(37) |
after the periodic steady-state condition is attained, and the oscillation amplitude is43
|
|
(38) |
where (AwAB)2 = (AwA)2 + (AwB)2 + 2 AwA AwBcos(dB - dA) and
|
|
(39) |
and where AwA, AwB, and dA, dB are estimated by Equation 10b.
 FIGURE 13. Dependence of the normalized amplitude AAB/AA of the concentration wave that passed through the membrane at frequency
w, and the ratios of the diffusion coefficients of the gas mixture components DA/DB (PA = PB, and the gas mixture composition at the membrane inlets is A:
B = 50:50).
FIGURE 13. Dependence of the normalized amplitude AAB/AA of the concentration wave that passed through the membrane at frequency
w, and the ratios of the diffusion coefficients of the gas mixture components DA/DB (PA = PB, and the gas mixture composition at the membrane inlets is A:
B = 50:50).
Figure 13 illustrates the amplitude-frequency characteristics of the membrane for the mixture of gases A and B at various values of DA/DB (the composition of the mixture at the membrane inlet A/B = 50:50). Calculations were performed for PA = PB. It is seen that the oscillation amplitude of the gas mixture at the membrane outlet at decreasing wave frequency (w→ 0, AwAB/AwA→ 2) will be determined by both components of the gas mixture. With increasing frequency w, the term AwAB(w)/AwA passes through a minimum, and at w →∞, AwAB/AwA → 1. The minimum point of the curve of the dependence of AwAB(w)/AwA on w is due to the fact that the phase shift between the output oscillations of components A and B, DdAB =| dA �dB| →p/2, results in a decrease of the total value of the output oscillation amplitude. At sufficiently high frequency w, the amplitude AwB for the component with the lower diffusion coefficient is small and the total amplitude of the output oscillations, Aw, is determined mainly by the amplitude for the mixture component with a high diffusion coefficient.
 FIGURE 14. Passage of the concentration wave of a mixture of two gases through the membrane at various frequencies: (a) oscillation frequency
w= 5 (PA = PB, DA = 10DB); (b)
w = 60 (PA = PB, DA=10DB); (c) experimental data on the He-CO2 gas mixture at oscillation frequency
w = 0.628 rad/s.
FIGURE 14. Passage of the concentration wave of a mixture of two gases through the membrane at various frequencies: (a) oscillation frequency
w= 5 (PA = PB, DA = 10DB); (b)
w = 60 (PA = PB, DA=10DB); (c) experimental data on the He-CO2 gas mixture at oscillation frequency
w = 0.628 rad/s.
Figure 14 illustrates the dependences of the flux at the membrane outlet of the gas mixture components for which the permeability coefficients in the membrane are equal and the diffusion coefficients differ by the factor 10 (DA = 10DB). It is seen that, when the frequency increases from 5 to 60 rad/s, the oscillation amplitude for the component with lower D drops abruptly, whereas for the component with a higher D the amplitude decrease is negligibly small.
Thus, filtration of the output oscillations from the signal of the component of low D is attained by changing the frequency of the input oscillations of the concentration wave.
Let us consider the problem of gas separation by diffusion across a microheterogeneous membrane under non-steady-state conditions. We shall assume that the diffusion process of gas A in polymeric solids obeys the classical mechanism of diffusion. In the course of gas B motion the molecules are trapped by defects, i.e., gas B diffusion is submitted to one of the variants of dual mode sorption theory.
As previously mentioned, under steady-state conditions the Henry I (mobile)-Henry II (immobile) model predicts the equality of gas fluxes through defects and homogeneous media (Table 1, Case 2). Therefore, the stationary separation factors for defects and for a defect-free medium are identical. However, the non-steady-stage separation factor depends on the duration of diffusion, t, on the gas-defect interaction parameters k1, and k2, and on the membrane composition, j1 and j2. Several examples of time dependences for a are given in Figure 15. For Henry I-Henry II models, the selectivity factor does not depend on the gas concentration.
In some other variants of dual mode sorption theory (Henry-Langmuir, Langmuir-Langmuir, etc.) the separation factor depends on the gas concentration. In the real situation, gas A and gas B can interact with membrane defects. Then the non-steady-state selectivity factor depends on the duration of the diffusion, the gas mixture composition, the gas-defect interaction parameters, the membrane composition, and temperature in a complicated manner.
Membrane separation processes using a steady cycling operation attracted a great deal of interest, documented by the articles by Barrer,42, 43 Beckman,10, 44, 45 Paul,1 and Higuchi.46 Paul1 reported that considerable improvements in separation efficiency may be achieved by steady cyclic pulsing of the gas pressure on the upstream side of the membrane (integral version of the permeability method). The effectiveness of the pulsed scheme of operation depends on the relative time scale of the pressure and the relaxation time�i.e., T and W (see Figure 4)�and the natural time scale of the membrane-gas system�i.e., t1B = l2/6DB.1,44,48 If D and S are constants for all species, the system behaves in a linear fashion and there is no enhancement if permeate collects continuously. To realize the benefits of this method of operation, the permeate must be collected alternately in at least two receiving vessels. The productivity of a membrane for given species has a drastic minimum in qt/qss at small values of W. Because of this minimum, improved separation factors may be realized. The recovery of helium from natural gas was used as an example of a separation type that can advantageously employ pulsed-membrane operation.
 FIGURE 15. Dependence of the separation factor on time (for the Henry I [mobile]-Henry II [immobile] model, D/l2 = 1, and
K = 1): (Curve 1) k1 = 100, k2 = 100; (Curve 2) k1 = 10, k2 = 10; (Curve 3) k1 = 1, k2 = 1; (Curve 4) k1 = 0.1, k2 = 0.1.
FIGURE 15. Dependence of the separation factor on time (for the Henry I [mobile]-Henry II [immobile] model, D/l2 = 1, and
K = 1): (Curve 1) k1 = 100, k2 = 100; (Curve 2) k1 = 10, k2 = 10; (Curve 3) k1 = 1, k2 = 1; (Curve 4) k1 = 0.1, k2 = 0.1.
Higuchi and Nakagawa46 have reviewed a number of examples of gas separation in non-steady-state conditions. Non-steady-state flux ratios of oxygen to nitrogen in the poly (dimethylsiloxane) membrane were theoretically investigated as a function of time. In a time-lag-type experiment, the flux ratios for O2 to N2 in PDMS membrane,
J(O2)/J(N2), at t/l2 = 600 s/cm2, is estimated to be 215,300, although the flux of O2 is 109 times lower than that at steady state. The value
a(t) = J(O2)/ J(N2) increases with a decrease in time (at
t→∞, at
→ ass = 1.944). The permeation time needed for such non-steady-state operation is generally too short to be utilized practically for conventional permeation conditions. If the upstream pressure is varied with period of
T = T1 + T2, T1 = 0.15 s and
T2 = 15 s for the present model membrane with l = 0.01 cm, the ratios of the permeated amounts of oxygen and nitrogen,
![]() = 259.9 and
= 259.9 and
![]() = 1.944.
= 1.944.
Another attractive application of non-steady-state operation has also been examined by Higuchi and Nakagawa.46 The separation of isotopic compounds is generally regarded to be difficult due to their similar chemical and physical properties. The model calculations are performed on the conditions of D(235UF6) = 1.00429�10-5 cm2/s, D(238UF6) = 1.00000�10-5 cm2/s, and porous membrane. The flux ratio of uranium-235 to uranium-238 in the non-steady state is calculated to be 1.144 at t/l2 = 800 s/cm2, which is higher than the ideal separation factor (1.004299) at steady state.
If the objective is to obtain 5% concentration of 235U, it should be repeated 900 times at the steady state. If the uranium enrichment is performed by non-steady-state membrane methods, the required number of repetitions is only 29.
Experimental testing of the pulse method is exemplified by separation of a He-CO2 gas mixture on a polymeric pqlyivinyltrimethylsilane) (PVTMS) film (l= 147 mm).10,44 The permeability coefficients of He and CO2 in PVTMS are approximately equal, whereas the diffusion coefficients differ by a factor 74 (see Table 3). The model experiments were performed using films of this polymer on a gas mixture comprising 47% He and 53% CO2.
The amplitude-frequency characteristics for He and CO2 are adduced in
Figure 16.44 At frequencies above = 0.77 rad/s, the oscillation amplitude < 1% of the minimum value, whereas the amplitude of the output oscillations of He,
![]() < 20%.
Figure 16 illustrates the dependence of the input and output signals of the He-CO2 gas mixture on time with the frequency of inlet oscillations
w being equal to 0.628 rad/s. It is seen that under these conditions the detector records only the signals coming from He.
< 20%.
Figure 16 illustrates the dependence of the input and output signals of the He-CO2 gas mixture on time with the frequency of inlet oscillations
w being equal to 0.628 rad/s. It is seen that under these conditions the detector records only the signals coming from He.
The application of non-steady-state boundary conditions provides active control over the processes of gas transfer into the membrane. It is shown that non-steady-state boundary conditions also allow us to achieve a considerable increase (by a factor of several orders of magnitude) in the separation factor a (He-CO2) using a relatively nonselec-tive poly(vinyltrimethylsilane) membrane.
TABLE 3. Transport Parameters of He and CO2 in Poly(vinyltrimethylsilane)
|
Gas |
Permeabilitya |
Diffusivityb |
|
He |
1.8�10-8 |
370�10-7 |
|
CO2 |
1.9�10-8 |
5.0�10-7 |
| a P (cm3�cm/[cm2�s�cmHg]). b D (cm2/s). |
||
 FIGURE 16. Amplitude-frequency characteristics for the He-CO2 mixture in the PVTMS membrane: (D) experimental results with respect to diffusion of CO2; (o) experimental results with respect to diffusion of He; (Curve 1) theoretical amplitude-frequency characteristics for CO2 in the PVTMS membrane; (Curve 2) theoretical amplitude-frequency characteristics for He in the PVTMS membrane.
Application of moving membranes allows one to accomplish spatial separation of gas-mixture components.45,47,49 In the course of an experiment, one can use a diffusion cell separated into two chambers by a moving polymeric membrane (Figure 17). The velocity of the membrane motion is selected such that the mobile component of the gas mixture should have enough time during the membrane passage through the diffusion cell to pass almost completely through the membrane, whereas the slow component does not have enough time to diffuse into the membrane very deeply and is carried along with it into the neighboring cell. In this case, separation is achieved owing to the difference in the values of the unsteady-state selectivity factors.
When the experiment is conducted according to another scheme (Figure 18), the polymeric gas-separation membrane stays immobile, but a specific selected liquid flows through the diffusion cell.45,50,53 The following versions are possible in selecting the liquid:
The flowing liquid can be nonspecific with respect to the separated gas mixture.
The solubility constants of the gas-mixture components in the absorption medium differ considerably.
The liquid is capable of chemical interaction with one or several components of the gas mixtures.
In the course of separation, the gases pass through the membrane, dissolve in the liquid absorbent, and are carried along into the desorber. To describe the work of such a device one must make use of the separation factors listed in Table 2.
In the membrane module with the flowing liquid membrane, the productivity and selectivity obviously will depend on the transport parameters of the gases in the absorption liquid, on the time it takes for the liquid to pass from the diffusion cell to the desorber, as well as on the time of passage through the desorber.
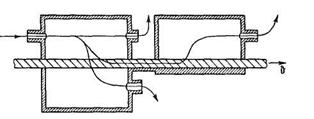 FIGURE 17. Block diagrams of the different modifications of gas-separation devices with mobile membranes.
 FIGURE 18. Membrane permabsorber with moving liquid layer: (a) continuous-flow membrane absorber; (b) circulatory membrane absorber. Parts are identified as follows: I �absorber module; II�desorber module; 1�reservoir chambers for placing the original gas mixture; 2�chamber for a liquid absorbent; 3�polymeric membrane; 4�receiver.
The membrane permabsorber (MPA) consists of two cells (absorption cell and desorption cell) and the liquid specifically selected as an agent for extraction that circulates between them (Figure 18).52 The gas mixture passes over the polymeric membrane in the absorption cell. The most permeable component of the gas mixture diffuses selectively through the nonporous polymeric membrane into the flowing liquid under it, is absorbed by this liquid, and is transferred to the desorption cell. Degassing of the liquid occurs in the desorption membrane cell through the nonporous polymeric membrane, leading to highly concentrated gaseous products. There are two operating conditions of the membrane device: a flowing device, where the liquid is discharged out of the gas-separating device, and a circulating device, where the liquid is continuously circulated in the system.
To facilitate practical calculations, we shall perform a simplified analysis of the work of a membrane permabsorber consisting only of one absorber module and one desorber module. An analytical solution of this problem for the steady state can be obtained on the following assumptions: (1) gas diffusion coefficients in the liquid are much greater than those in polymeric membranes; (2) distribution of penetrant concentration over the polymeric membrane is linear; (3) the flow-rate profile of the liquid is uniform; (4) diffusion of the liquid component through the polymeric membrane does not affect the penetrant gas transfer coefficient; (5) absorption of the gas in the liquid follows Henry's law; and (6) the membranes in the absorber and desorber modules are rectangular and of equal surface area.
With these assumptions, the work of a membrane absorption-desorption gas-separating system is described by the following equations:
|
|
(0≤x≤l) | (40a) |
|
|
(1≤x≤h) | (40b) |
where q = c/c0, Ga = S1tl1 lma/(SmaDmaha) = S1t*/Qma, Gd = S1t*/Qmd, t= (ha+ hd)/hd, x = y/ha, c0 = S1 r0, and A = hd, and where r0 is the partial pressure of the penetrant (atm), Qm =ADS/lm is the productivity (cm3(STP)/[s � atm]), u* is the volume flow rate of the liquids (cm3/s), u is the linear rate of the liquids in a membrane absorber (cm/s), l is the membrane thickness, h is the membrane length, d is the membrane width, c is the gas concentration, y is the coordinate in the direction of moving liquids, and the subscripts are as follows: a, absorber; d, desorber; l, liquid absorbent; m, membrane.
The solution of the ordinary differential Equations 40a and 40b has the following form:
|
c1a = c0(l-Kaexp(-x/Ga)) |
(41a) |
|
c1d = c0(l-Kdexp(-x/Gd)) |
(41b) |
where Ka and Kd are constants determined from the boundary conditions.
One can identify two principal types of membrane permabsorbers: the continuous-flow type and the circulating type.
In a continuous-flow-membrane permabsorber fresh liquid is fed into the absorber module. It carries the penetrant, which has passed through the membrane, into the desorber module and is then discharged out of it (Figure 18a). The boundary conditions in this case are x = 0, qla = 0 and x = 1, qla = qld.
Applying these conditions to Equations 40, we get
|
|
(42a) |
|
|
(42b) |
where c0 is the penetrant concentration at the membrane absorber inlet and c(0) is the background concentration of the penetrant in the liquid. Then the concentration profiles along the direction y are
|
|
(0≤x≤l) | (43a) |
|
|
(1≤x≤h) | (43b) |
The local flux of the penetrant (i.e., the flow at point y) from the desorber is
|
|
(44) |
The total flux of the penetrant at the desorber outlet is
|
|
(45) |
If c(0) = 0 and Ga = Gd = G = Slulllm/(SmDmh) = Slu*/Qm, then
|
J = Y(1 - exp(-1/G))2 |
(46a) |
|
Y = ASlllur0/h = Slp0u* |
46b) |
( where c0 = Smar0 and u* = ullA/h is the volume flow rate of absorbent.
If u*→ 0, J → 0. At small u* values, J ~ u*, i.e., the flow linearly increases with increasing volumetric flow rate of the liquid. With large u* values J→0.
The total, steady, differential selectivity factor is determined by the formula52
|
|
(47) |
where the limits are
 and
and

Now we shall briefly discuss the results of mathematical simulation of the membrane absorber operation. Figure 19a shows the distribution profiles for penetrant concentration along the direction x, calculated for different contact time values of the absorbent moving at a linear rate uy along the membrane, T = y/uy, Dma/lma2 = 1, and Dl/lla2 = 10. It is seen that, with a constant uy, the concentration profile c(x) even in the steady state, is not linear and the penetrant distribution across the layer of the liquid (in the direction x) is not uniform. From Figure 19a it also follows that, as the flow rate of the liquid increases, the penetrant concentration in it drops. Note that, when calculating the curves shown in Figure 19a, we assumed Sm = Sl If Sm ≠ Sl, then at xma = la concentration jump will be observed at the interface.
 FIGURE 19. Penetrant concentration distribution (a) across and (b) along the membrane absorber: (a) concentration profiles in the absorbing part of the unit in the direction perpendicular to the membrane surface h/v = 0.0 (1), 0.1 (2), 0.2 (3), 0.3 (4), 0.4 (5), 0.5 (6), 0.6 (7) s; (b) concentration profiles in the absorbing part of the membrane absorber in the direction along the membrane surface.
Figure 19b describes the distribution of the average concentration of the penetrant in the liquid along the direction y. At sufficiently high y values the concentration is seen to become constant.
Proceeding from these facts, one can expect that the separation process of a binary mixture will be characterized by a total separation factor (Figure 20). With a constant absorber length, the plot of a(y), calculated from Equation 4 in Table 2, is seen to have a clearly defined maximum (a situation similar to the pulsed gas-separation mode, but here the role of pulse duration is played by the flow rate of liquid). On the other hand, the total separation factor a(y) depends on the rate of absorbent motion: There exists a rate at which the separation factor reaches maximal value.
It is important to emphasize that in the example given PA = PB, i.e., the separation of gases is impossible under steady-state conditions; the liquid is also nonspecific � SlA = SlB, DlA = DlB, i.e., one cannot separate these gases by the absorption method. However, separation of such a mixture proves to be possible in a membrane absorber (because of the difference in the diffusion coefficient values for different gases in the polymeric membrane: DmaA ≠DmaB (at the optimum value of the extract-ant rate of motion ug, a = 1.92).
The dependence of normalized productivity and selectivity factors, for gases A and B in membrane absorber, via flow rate of the liquid are shown in Figure 21. One may see (Figure 21a) that the maxima of productivity for gases A and B are situated at different flow rates of the absorbent although QmA = QmB. The position of the maximum in the case of continuous-flow membrane absorber is determined by the solubility coefficient of gas in liquid. It is obvious that by varying the flow rate of the liquid one can invert the selectivity factor in a continuous-flow membrane absorber.
 FIGURE 20. Separation factor in membrane absorber vs. the parameter
h/u: DmA/DmB = 10;
SlA / SlB = 0.1 (PmA/PmB = 1);
Df/Df = 1; SlA / SlB = 1.
FIGURE 20. Separation factor in membrane absorber vs. the parameter
h/u: DmA/DmB = 10;
SlA / SlB = 0.1 (PmA/PmB = 1);
Df/Df = 1; SlA / SlB = 1.
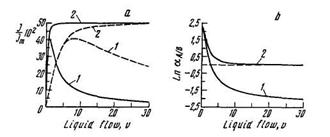 FIGURE 21. Dependence of (a) productivity and (b) separation factor in membrane absorber via flow rate of the liquid (SlA / SlB = 10; PmA/PmB = 1): (Curve 1) continuous flow; (Curve 2) circulatory flow; for gas A (���) and gas
B (----).
FIGURE 21. Dependence of (a) productivity and (b) separation factor in membrane absorber via flow rate of the liquid (SlA / SlB = 10; PmA/PmB = 1): (Curve 1) continuous flow; (Curve 2) circulatory flow; for gas A (���) and gas
B (----).
In a circulatory-membrane permabsorber52,53 the extractant, after leaving the detector, is again fed to the absorber inlet (Figure 18b). The main advantage of this modification is that the extractant continuously circulated between the absorber and the desorber and is not consumed.
In this case the boundary conditions are as follows:qla(l) = qld(l) and qla(0) = qld(h). Then
|
|
(48a) |
|
|
(48b) |
The total flux of the penetrant at the desorber outlet
|
|
(49) |
with Ga = Gd = G and ha = hd, the flux is
|
|
(50a) |
|
|
(50b) |
If u* → 0, then J→ 0. At small u* values, J ~ u*, i.e., the flow linearly increases with increasing volumetric flow rate of the liquid. With large u* values, J→ 0.5Qmr0. The limits for the selectivity factor are
|
|
and |
|
The maximum productivity to be achieved in circulatory membrane absorber is one half of the membrane productivity for the gas under investigation (Figure 21a).
Comparison of the different versions of membrane absorber operation shows the productivity of the circulatory membrane absorber to be 1/(1 - exp(-2/G)) times greater than that of a continuous-flow absorber. Here lies the second advantage of circulatory mode.
The total, steady, differential separation factor in circulatory MPA is determined by the formula
|
|
(51) |
where the limits are
|
|
(selectivity of absorption liquid) |
|
|
(selectivity of membrane) |
Varying the flow rate of the absorbent, one can change the separation factors of separation (Figure 21b).
The experimental results of biogas separation by circulatory MPA are shown in Figure 22, with achievement of separation factor values for the gas pair CO2-CH4 of up to ~ 3000.
 FIGURE 22. The experimental results of separation of the gas pair CO2-CH4 by circulatory membrane absorber (10% aqueous solutions monoethanolamine; asymmetric membranes produced from poly(vinyltrimethylsilane)): (a) productivity; (b) selectivity factor.
A so-called membrane valve consists of two modules: a permeator and a desorber (Figure 23).54 The permeator is divided by two polymeric gas-separation membranes, Ml and M2, between which a thin layer of the absorbent liquid is moving. The investigated gas mixture and gas-carrier are passing under the surface of sandwich. The components of the gas mixture are dissolved in the liquid absorbent and are driven out of the permeator to the desorber (membranes M3 and M4). The selective membrane valve (SMV) has one inlet for the initial gas mixture and three outlets for the product leaving the separation device. The SMV can be used to separate a three-component gas mixture: the gas insoluble in the absorbent passes above the membrane, the fast component of the gas mixture passes through the composite membrane, and the third component, dissolving well in the absorbent, is entailed by the liquid into the desorber.
There are four operating conditions of the SMV: a flowing mode without a desorber (F), a flowing mode with desorber (FD), a circulator mode without a desorber (C), and a circulator mode with a desorber (CD).
 FIGURE 23. Block diagrams of the membrane valve; with parts identified as follows: 1�reservoir; 2�membrane Ml; 3�chamber for a liquid absorbent; 4�membrane M2; 5�receiver of the permeate; 6�valve; 7�circulator; 8�receiver of the desorber; 9�membrane M3; 10�membrane M4.
a. Mode F
Consider gas permeability of a three-layered medium consisting of a polymeric membrane 1 (with parameters Dml, Sml, lml, and A1 = d1h1), a thin layer of liquid absorbent (D1, S1, l1, A1) being moved at a linear velocity u, and polymeric membrane 2 (Dm2, Sm2, lm2, A1), H=lml + l1 + lm2 is tne total thickness of sandwich.
If D1 >> Dml and D1 >> Dm2, the two-dimensional task can be reduced to a one-dimension equation:
|
|
(52) |
A solution of Equation 52 under boundary conditions cl(y = 0) = c(0), cm1(x = 0) = C10 = Smlr10, and cm2(x = H) = c2H = Sm2r1H is as follows:
cl = (G1V + (G2Vc(0) - G1V)exp(-G2Vy/G))/G2V
where
|
|
|
The penetrant total flux leaving the sandwich is
|
|
(53) |
If the gas concentration in the liquid at the input to the permeator is c(0) = 0, the partial gas pressure p1H = 0 (output), p10 = p0 (input), and Pm1 = Pm2 = P, lml =lm2 =l, G1V = G, Sml = Sm2 = S, then
|
|
(54) |
As one can see, the gas permeability through the sandwich depends on the solubility coefficient for the liquid. Under conditions of slow velocity of moving liquid (u→0), the flux J3→ APr0/2l, i.e., the flux is 0.5 times the membrane productivity, but under fast rates of moving liquid (u→�), J3 →0, i.e., the membrane valve is closed.
The separation factor for gases A and B is
|
|
(55) |
where Y = AP/u*lSl; the limits are
|
|
and |  |
b. ModeFD
The desorber is divided by two polymeric membranes: Membrane 3 (with parameters Dm3, Sm3, l3, and A2 = d2h2) and Membrane 4 (Dm4, Sm4, lm4, A2), between which is moving a thin layer of absorbent liquid (lld is the liquid layer thickness in the desorber).
The operational peculiarities of the flowing membrane permeator that has an input flowing-membrane permeator can be illustrated by the simplest example:
| Sm1 = Sm2 = Sm3 = Sm4 = S | S1l = S2l = Sl | Dml = Dm2 = Dm3 = Dm4 = D | c10 = c0 |
| c2H = c30 = c40 = 0 | c(0) = 0 | h1= h2= h | A1 = A2 = A |
| d1 = d2 = d | lm1= lm2= lm3= lm4= l | ll1= ll2= ll |
The gas flow from the desorber is
|
|
(56) |
where the limits are
|
|
|
 |
|
Thus there are possibilities for controlling the compositions and fluxes of permeable gas mixtures through gas-membrane-liquid systems by optimizing liquid flow rates.
c. Mode CD
In the circulating SMV, a liquid absorbent is driven to the membrane desorber (MD) upon leaving the membrane permeator (MP). Passing through the MD, the liquid is degassed and is driven to the permeator input.
We shall confine ourselves to the simplest case:
| Sm1 = Sm2 = Sm3 = Sm4 = S | Dml = Dm2 = Dm3 = Dm4 = D | c10 = c0 | c(0) = 0 |
| c2H = c30 = c40 = 0 | A1 = A2 = A | lm1= lm2= lm3= lm4= l | ll1= ll2= ll |
The gas flux from the permeator is
|
|
(57) |
where the limits are
|
|
and |
|
In the circulation mode, the gas flow through the permeator can never be completely suppressed:

i.e., selectivity of the circulation permeator with a desorber is the same at both high and low speeds of liquid motion. The gas flux from the desorber is
|
|
(58) |
where the limits are
|
|
|
 |
 |
The proposed model has been tested by separating a three-component gas mixture CO2-CH4-H2 using the SMV operating in the circulation mode with desorber. Asymmetric membranes produced from PVTMS and aqueous solutions monoethanolamine of different concentrations served as the carrier of CO2. The initial CO2-CH4-H2 gas mixture consisted of 40% CO2, 30% CH4, and 30% H2, respectively. The concentrations of each separated gas obtained were more than 90% at the outlets of the membrane valve. The simplified model considered is shown to describe the experimental data adequately.
Gas separations by immobilized liquid membranes using carriers that can selectively and reversibly bind certain permeant species have attracted attention because very high selectivity (due to the specifity of the reaction between carriers and permeant species) as well as high permeability (due to the facilitation effect) can be achieved.55-57
Most of the liquid membranes used were immobilized liquid membranes, consisting of thin porous filters such as cellulose acetate impregnated with carrier solutions. These liquid membranes have the disadvantage that they are apt to degrade because the solution absorbed in the pores of the support membrane evaporates into the feed and sweep gas phases.
Another type of liquid membrane that has been used in laboratory research to obtain reproducible permeability data is a thin-layer liquid membrane, in which a membrane solution is held stationary between two microporous membranes.58 Although the stability of this type of membrane seems to be better than that of immobilized liquid membranes in which the carrier solution is absorbed in the pores of the microporous support membranes, the mass transfer resistance through the layer of the membrane solution is large because the layer is thick and stationary.
In order to overcome these inherent problems of these two types of liquid membrane, a new type of liquid membrane for gas separation was proposed, called flowing liquid membranes.50 Separation of ethylene from ethane by flowing liquid membrane modules was carried out, with silver nitrate used as a carrier of ethylene. It was found that, compared with the usual immobilized liquid membranes, the flowing liquid membrane was higher permeability and stability.
By reducing the total pressure of the receiving phase, more than 98 mol% of ethylene was obtained from an approximately equimolar mixture of ethylene and ethane.
Recovery, purification, and enrichment of gases and treatment and control of the gas mixture compositions are very important in many processes of modern chemical technology and for ecology. The corresponding devices have considerable importance as well from the viewpoint of environmental protection. At the moment, the separation of gases is carried out in different apparatuses based on cryogenic, sorption, and membrane processes. Each of them has its own benefits and disadvantages. For the creation of optimized technological systems, the combined application of the different treatment methods is of interest. The next stage of the combination of different gas-separation methods is the creation of integrated systems of membrane technology (ISMT). The membrane catalysts, membrane permabsorber, membrane valve, and chemical and biochemical membrane reactors can serve as the examples.
There are several features of ISMT:
A complex spatial and chemical organization
A nonequilibrium or metastable state in the transport process
The non-steady-state conditions of the transport processes
The intrinsic (the original instability of systems, for example, temperature and concentration oscillations) or external (time-dependent boundary conditions such as pulsed-membrane operation, cosine, square, or triangular concentration waves, using mobile membranes, flowing liquid membranes, etc.) causes are assumed to provide the non-steady-state effects.
One might anticipate that certain advances in the field of gas separation by ISMT would result from the combined efforts of researchers in fundamental studies on the theory of unsteady-state transport of low molecular weight compound in heterogeneous media, as well as from the achievements of chemical engineers in producing the experimental apparatuses for application of time-dependent boundary conditions of the membrane reactor inlet. These results can be used as the basis for selecting the optimum conditions of operation of the integrated systems of membrane technology.
Paul, D. R., Ind. Eng. Chem. Process. Des. Dev., 1, 375, 1971.
Beckman, I. N., Thermochim. Ada, 190, 66, 1991.
Beckman, I. N., Shvyryaev, A. A., and Balek, V., in Synthetic Polymeric Membranes, Sedlazek, B. and Kohovec, J., Eds., Walter de Gruyter, Berlin, 1987, 355.
Shvyryaev, A. A. and Beckman, I. N., in Diffusion Phenomena in Polymers, Publ. House OICHF Academy of Sciences U.S.S.R., Chernogolovca, 1985, 44.
Palmai, G. and Olah, K., J. Membrane Sci., 21, 161, 1984.
Beckman, I. N., Romanovskii, I. P., and Balek, V., in Synthetic Polymer Membranes, Sedlazek, B. and Kohovec, J., Eds., Walter de Gruyter, Berlin, 1987, 363.
Beckman, I. N. and Balek, V., in Proc. ICOM-87, Tokyo, 1987, 09P06.
Beckman, I. N., Gabis, I. E., Kompaniets, T. N., Kurdyumov, A. A., and Lyasnikov, V. I., in Reviews of Electronics Ser., Technology, Production, Management and Equipment, Vol. 1(1084), Electronics, Moscow, 1985, 1.
Beckman, I. N., Shelekhin, A. B., and Teplyakov, V. V., /. Membrane Sci., 55, 283, 1991.
Beckman, I. N. and Romanovskii, I. P., Usp. Khim., 57, 944, 1988.
McNabb, A. and Foster, P. K., Trans. Metall. Soc. AIME, 337, 618, 1963.
Beckman, I. N., in The Reaction of Hydrogen with Metals, Zakharov, A. P., Ed., Nauka, Moscow, 1987, 143.
Dubinin, M. M., Prog. Surf. Membrane Sci., 9, 1, 1975.
Koros, W. J., /. Polym. Sci., 18, 981, 1980.
Cohen, D. S., /. Pofym. Sci., 21, 2057, 1983.
Paul, D. R. and Koros, W. J., /. Polym. Sci., 14, 675, 1976.
Vieth, W. R. and Sladek, K. J., J. Colloid. Sci., 27, 177, 1968.
Petropoulos, J. H., J. Polym. Sci. A, 2(8), 1797, 1970.
Bhatia, D. and Vieth, W. R., J. Membrane Sci., 6, 351, 1980.
Hurst, D. G., in CRRP-1124 Atomic Energy of Canada, Chalk River, Ontario, 1962,1.
Kurdyumov, A. A., Gabis, I. E., and Mazaev, S. N., Fiz. Metal. Melalloved., 12, 1754, 1988.
Norgett, M. J. and Lidiard, A. B., Radiation Damage in Reactor Materials, Diffusion of Inert Gases in Ionic Crystals, IAEA, Vienna, 1969, 61.
McLellan, R. B., Ada Mettall., 27, 1655, 1979.
Oriani, R. A., Ada Mettall., 18, 147, 1970.
Peak, D., Corbett, J. W., and Bourgoin, J. C, /. Chem. Phys., 65, 1206, 1976.
Robertson, W. M., Scripta Mettall, 15, 137, 1981.
Barrer, R. M., J. Membrane Sci., 18, 25, 1984.
Barrer, R., in Diffusion in Polymers, Crank, J. and Park, G. S., Eds., Academic, London, 1968, 165.
Romanovskii, I. P. and Beckman, I. N., Vestnik MGU Ser. 2 Chem., 28, 260, 1987.
Ruckenstein, E., Vaidyanathan, A. S., and Youngquist, G. R., Chem. Eng. Sci., 26, 1305, 1971.
Zolotarev, P. P. and Dubinin, M. M., Dokl. Akad. Nauk USSR, 210, 136, 1973.
Bruggeman, D. A., Ann. Phys. (Leipzig), 24, 636, 1935.
Broadbent, S. R. and Hammersley, J. M., Proc. Cambridge Philos. Soc, 53, 629, 1957.
Kirkpatrick, S., Rev. Mod. Phys., 45, 574,1973.
Ottino, J. M. and Shah, A., Polym. Eng. Sci., 24, 153, 1984.
Ievlev, A. A., Teplyakov, V. V., Durgarian, S. G., and Nametkin, N. S., Dokl. Akad. Nauk USSR, 264, 1421, 1982
Beckman, I. N., Radiokhimia, 23, 760, 1981.
Beckman, I. N. and Shvyryaev, ?. ?., Radiokhimia, 24,126, 1982.
Buntseva, I. M. and Beckman, I. N., in Membranes and Membrane Separation, Nicolaus Copernicus University, Torun, Poland, 1989, 81.
Beckman, I. N. and Buntseva, I. M., J. Radionall. Nucl. Chem. Lett., 153(15), 345, 1991.
Paterson, R. and Doran, P., J. Membrane Sci., 27,105, 1986.
Barrer, R. M, /. Phys. Chem., 57, 351, 1953.
Aitken, A. and Barrer, R. M., Trans. Faraday Soc., 51,110,1955.
Beckman, I. N., Shelekhin, A. B., and Teplyakov, V. V., Dokl. Akad. Nauk USSR, 308, 635, 1989.
Beckman, I. N., in Int. Symp. Membranes for Gas and Vapour Separation, Suzdal, USSR, 1989, 24.
Higuchi, A. and Nakagawa, T., /. Appl. Polym. Sci., 37, 2181,1989.
Klass, D. L and Landahl, C. D., U.S. Patent 3,797,200,1974.
Klass, D. L. and Landahl, C. D., U.S. Patent 3,818,679,1974.
Beckman, I. N., Balek, V., and Kralicek, J., Czechoslovak Patent 244,791,1986.
Teramoto, M., Matsuyama, H., Yamashiro, T., and Okamoto, S., J. Membrane Sci., 45, 115,1989.
Shelekhin, A. B. and Beckman, I. N., in Proc. 1990 Int. Congr. Membranes and Membrane Processes, Chicago, Vol. 2,1990, 1419.
Shelekhin, A. B., Beckman, I. N., Teplyakov, V. V., and Gladkov, V. S., USSR Patent SU 1,637,850, 1991.
Shelekhin, A. B., Beckman, I. N., and Teplyakov, V. V., Theor. Osnov. Chem. Techn., 26, 570, 1992.
Beckman, I. N., Bessarabov, D. G., and Teplyakov, V. V., Ind. Eng. Chem. Res., 1993, in press.
chulz, J. S., Goddard, J. D., and Suchde, S. R., AlChE J., 20, 417,1974.
Scolander, P. F., Science (Washington, D.C.), 131, 565,1960.
Ward.'W. J. and Robb, W. L., Science (Washington, D.C.), 156, 1481, 1967.
Sirkar, K. K., U.S. Patent 4,750,918,1988.